Creates an Rle of fixed-with bins from a continuous numeric Rle
Usage
tileRle(x, bs = 10L, method = c("max", "min", "mean"), roundSummary = FALSE)
Arguments
- x
A numeric `Rle` (or `RleList`)
- bs
A positive integer specifying the bin size
- method
The method for summarizing bins
- roundSummary
Logical; whether to round bins with summarized coverage
(default FALSE)
Value
An object of same class and length as `x`
Examples
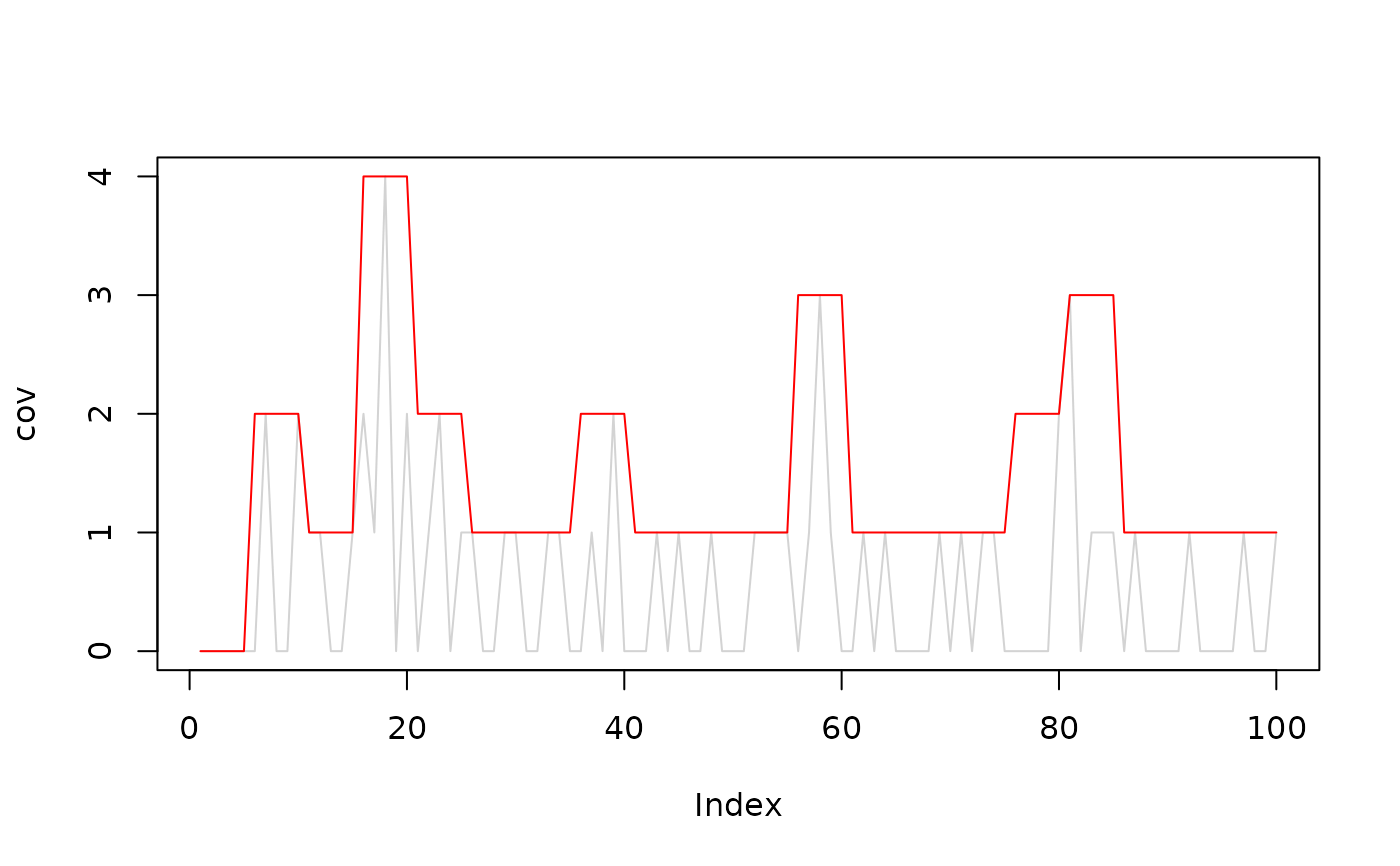
# creating a dummy coverage and visualizing it:
cov <- Rle(rpois(100,0.5))
plot(cov, type="l", col="lightgrey")
# summarizing to tiles of width 5 (by default using maximum)
cov2 <- tileRle(cov, bs=5L)
lines(cov2, col="red")