A wrapper for visualizing pairwise-wise overlaps across multiple sets of genomic ranges.
Arguments
- listOfRegions
A named list of two or more (non-empty) `GRanges`
- mode
Either 'reduced' or 'pairwise'. 'reduced' first uses `reduce` to get a set of reference regions which are, based on overlap, contained or not in the different sets. It is thus symmetrical. `pairwise` does pairwise overlap between the sets of regions; it is asymmetrical and slower to compute.
- ignore.strand
Logical; whether to ignore strand for overlaps (default TRUE).
- cluster
Logical; whether to cluster rows/columns
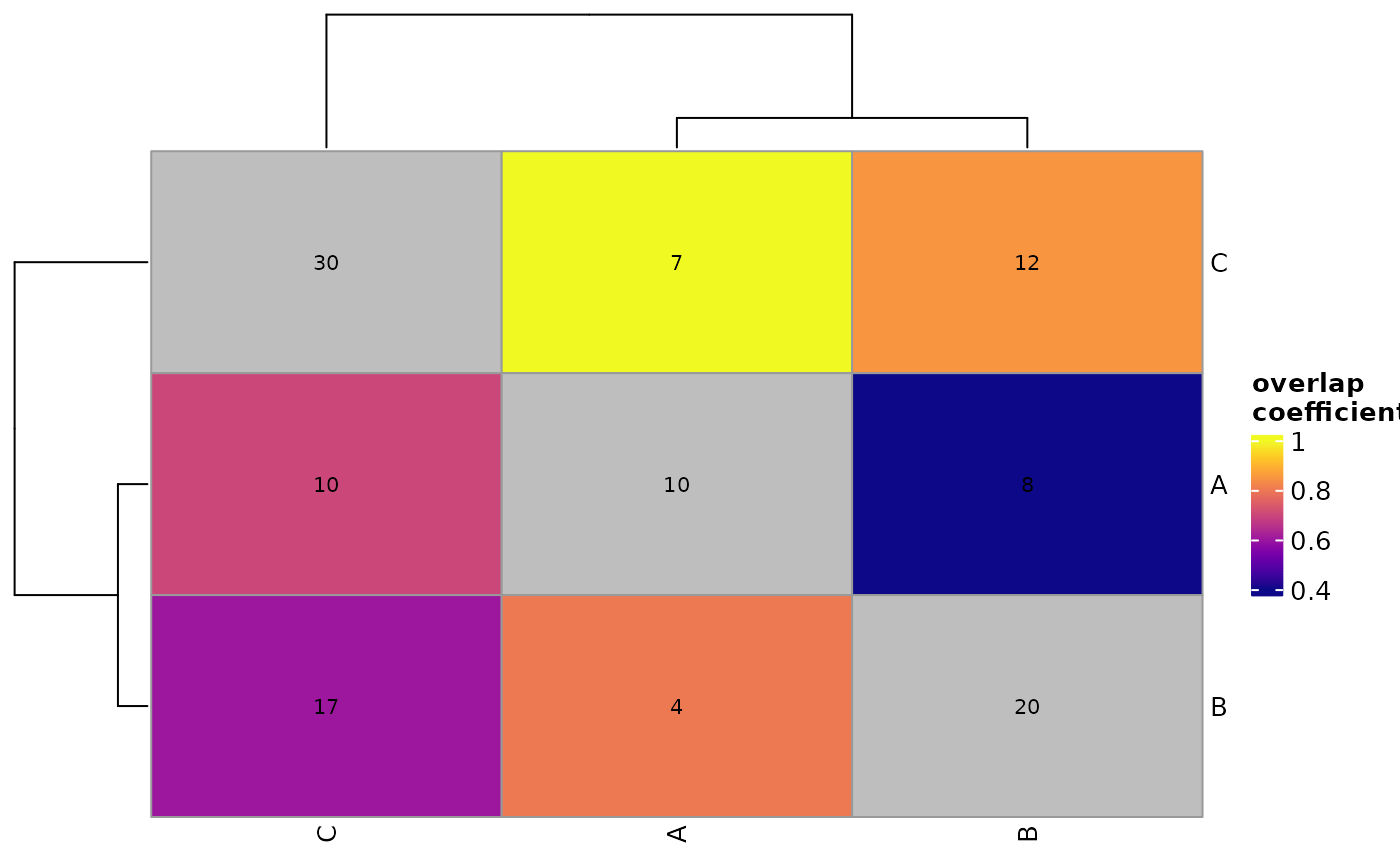
- colorBy
Whether to color by 'overlapCoef' (default), or by 'jaccard' index.
- ...
Passed to
pheatmap- returnValues
Logical; whether to return the matrix of requested values instead of plotting.
- color
Heatmap colorscale
- number_color
Values color