clusterSignalMatrices: clusters the regions of a (set of) signal matrices.
Source:R/signalMatrices.R
clusterSignalMatrices.RdclusterSignalMatrices: clusters the regions of a (set of) signal matrices.
Arguments
- ml
A named list of signal matrices or an EnrichmentSE object as produced by
signal2Matrix- k
The number of clusters to generate
- scaleRows
Logical; whether to scale rows for clustering
- scaleCols
Logical; whether to scale columns (i.e. signals/samples)
- use
What values to use for clustering. By default, uses
enriched_score. Other options are 'full' (uses the full signal for clustering), 'max' (uses the maximum value in the region), or 'center' (use the value at the center of the region).- by
Optional factor/character/integer vector of the same length as `ml`. When scaling rows, this can be used to indicate which rows should be scaled together.
- assay
Assay to use (ignored unless `ml` is an ESE object)
- trim
Values to trim (applied individually for each signal matrix)
- nstart
Number of starts for k-means clustering
- ...
Passed to `kmeans`
Value
If `k` is of length 1, a vector of cluster labels, corresponding to the rows of `ml`. If `length(k)>1`, a list of two data.frames containing: 1) the cluster labels at the different resolutions, and 2) the variance explained by clusters at each resolution.
Examples
data(exampleESE)
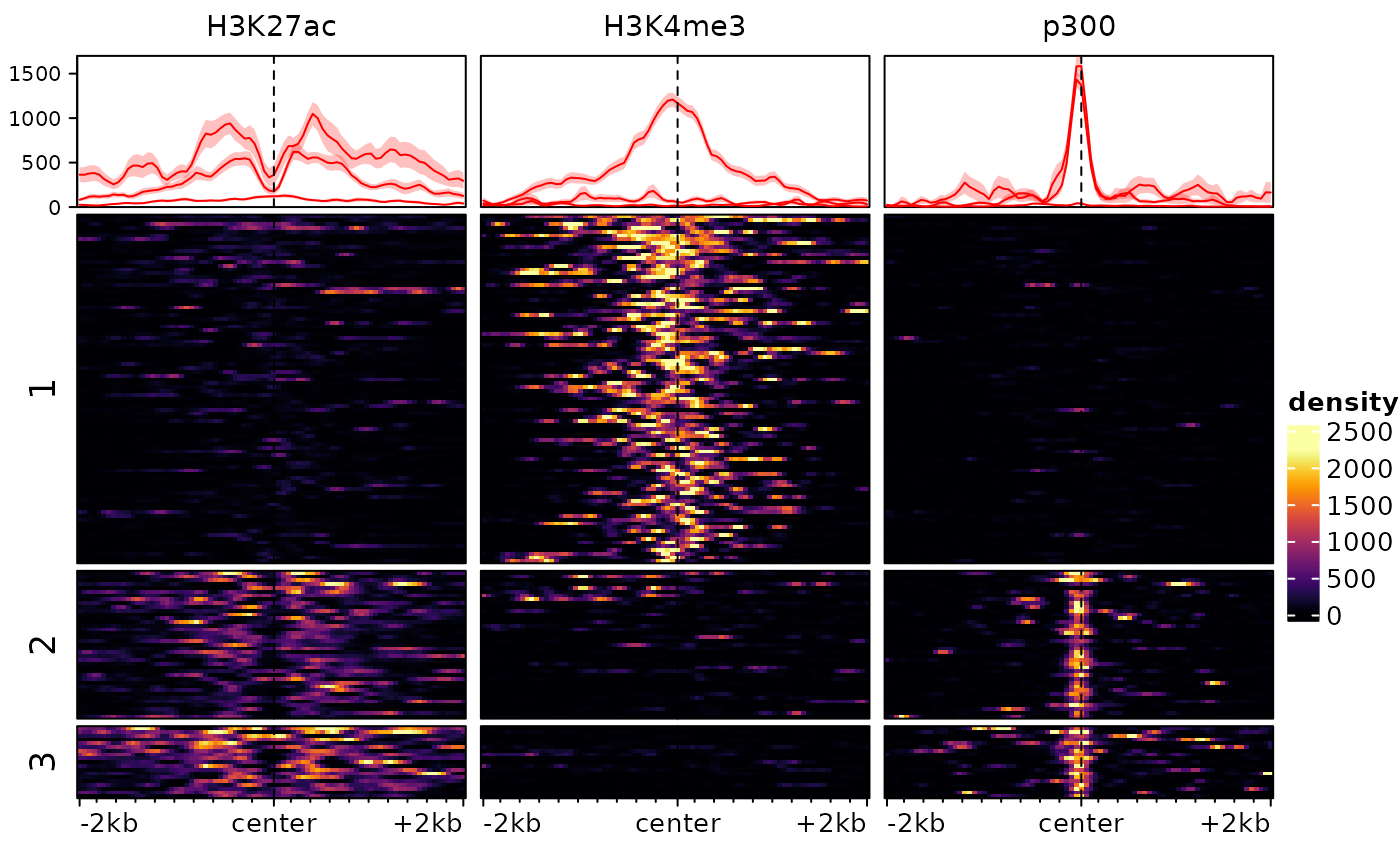
rowData(exampleESE)$cluster <- clusterSignalMatrices(exampleESE, 3)
#> ~82% of the variance explained by clusters
# we could plot the data clustered:
plotEnrichedHeatmaps(exampleESE, row_split="cluster")
 # we could also try with different values of k:
cl <- clusterSignalMatrices(exampleESE, 2:5)
cl$varExplained
#> k varExplained
#> 2 2 79
#> 3 3 87
#> 4 4 89
#> 5 5 90
# we could also try with different values of k:
cl <- clusterSignalMatrices(exampleESE, 2:5)
cl$varExplained
#> k varExplained
#> 2 2 79
#> 3 3 87
#> 4 4 89
#> 5 5 90